
Published on
·
7 minutes
Token efficiency is becoming a real advantage in AI developer workflows

Francisco García Sierra

Quick Summary
AI coding adoption is no longer just about using better models. It is increasingly about building better pipelines around them. In this post, we compare a baseline repository workflow against a setup improved with Distill, graph-based repository navigation, and tighter agent instructions. The result is not only lower token usage, but also less noise, faster iteration, and better signal on the parts of the task that actually matter.
The AI coding conversation is still dominated by model quality.
That makes sense. Frontier models are genuinely good now. GPT-5.4, Claude Opus 4.6, and the latest high-end coding models can already unlock meaningful output in real engineering workflows.
But there is another variable that is starting to matter just as much: how much it costs, how long it takes, and how clean the signal is by the time you get to a useful result.
Cost matters whether you are a small team, a mid-sized company, or a big org that just does not want to waste budget. Speed matters because nobody wants to wait around while an agent re-reads noise. And quality matters because when you cut useless token usage, you usually also cut noise, improve the granularity of the topics that matter, and make the final answer easier to trust.
That usually shows up as:
full test logs flowing back into the loop
verbose tool output for small next-step decisions
repeated repo exploration after context compression
agents rediscovering the same routes, services, and DTOs over and over
large codebases being re-read when the task only needs a narrow answer
For a while, many teams could ignore that tax. Credits were generous. Pricing felt forgiving. AI usage was still experimental.
That is already changing.
OpenAI introduced the Codex app with a limited-time period of higher Codex rate limits, then moved ChatGPT Business toward token-aligned Codex pricing and flexible Codex-only seats. That is a good example of the direction the market is taking: less hand-wavy bundled magic, more visibility into actual usage and actual spend.
Anthropic is also pretty explicit that Claude Code costs are something teams should track and manage, and that team access is tied to specific seat types and billing choices.
And the packaging story is changing there too. On April 4, 2026, Boris Cherny, head of Claude Code, said on X that Claude subscriptions would no longer cover usage on tools like OpenClaw, with that usage moving to extra bundles or API billing. Whether you agree with that move or not, it reinforces the same point: governance over your pipeline, your integrations, and your token usage is becoming part of the job. He clarified the same point in a follow-up post.
That window is closing.
Once AI becomes part of daily development inside a company, token usage stops being a side metric and starts becoming part of operating cost, latency, and throughput. The companies that fix their pipelines early will get more value from the same models, the same budgets, and the same developer hours.
That was the motivation behind a small benchmark we ran on one of our daily backend workflows.
The goal was not to make the model "smarter." It was to make the pipeline less noisy.
We focused on three levers:
Distillation Skill, a skill we built on top of the Distill project to reduce long outputs, CLI noise, and repeated MCP chatter down to the minimum an agent actually needs for the next stepGraph Skill, which uses Graphify to generate a knowledge graph of the repo and index files plus their relationships as nodes, so the agent can map a domain without re-exploring everything from scratcha tighter
AGENTS.md, to push the agent toward narrower, higher-value exploration patterns
The broader task benchmark
We ran the same prompt three times across three setups and averaged the results.
For readability, I’m using these public-facing names:
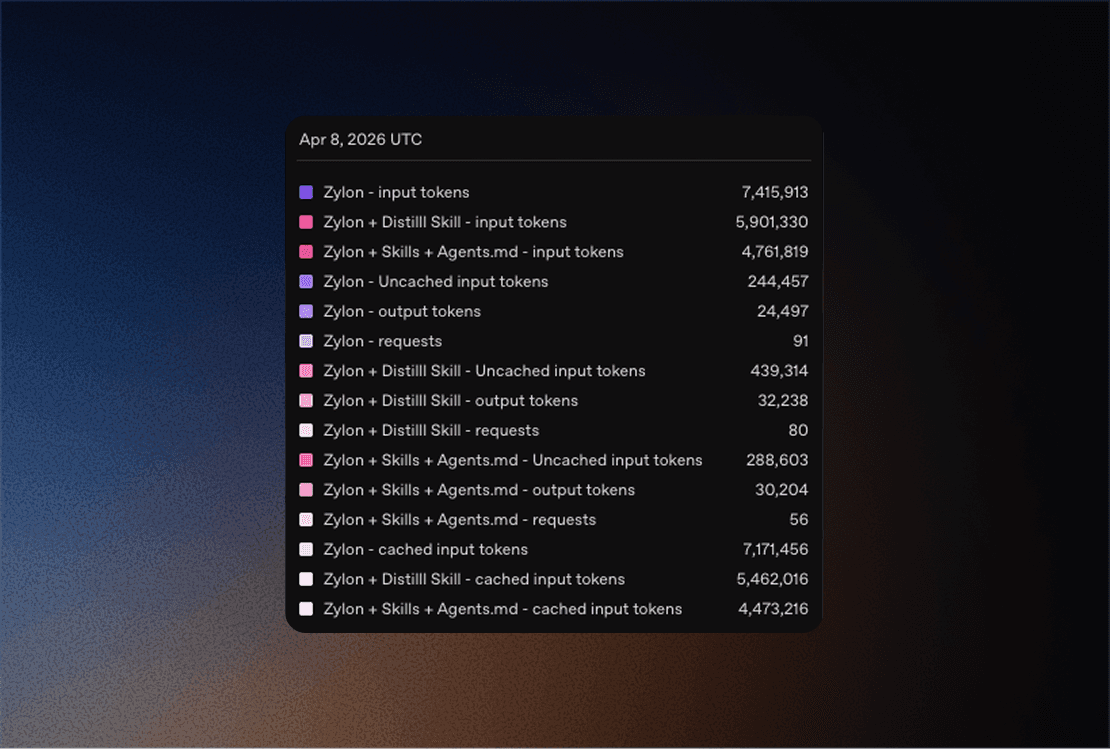
Setup | Avg runtime | Input tokens | Output tokens | Requests |
|---|---|---|---|---|
Baseline | 12m 30s | 7,415,913 | 24,497 | 91 |
Baseline + Distillation | 11m 19s | 5,901,330 | 32,238 | 80 |
Baseline + Distillation + Graph | 9m 10s | 4,761,819 | 30,204 | 56 |
Compared with the baseline:
Baseline + Distillationused20.42%fewer input tokens, made12.09%fewer requests, and finished9.47%fasterBaseline + Distillation + Graph Skillused35.79%fewer input tokens, made38.46%fewer requests, and finished26.67%faster
That is the headline result.
But averages across a full task can hide where the biggest wins actually come from.
The interesting part shows up when you isolate the noisiest sub-workflows.
Micro-benchmarks: where the biggest savings show up
1. Distilling a noisy test run
For the first micro-benchmark, we used a deliberately noisy target:
./gradlew :server:Test --tests backend.server.app.project.ProjectTest
To keep the comparison fair, we did not rerun the suite once raw and once distilled. That would have introduced warm-cache bias.
Instead, we:
ran the test suite once
saved the raw output
distilled that exact saved log
This isolates the context-compression effect from Gradle execution variance.
We estimated token volume with a simple characters / 4 heuristic.
View | Runtime | Lines | Characters | Estimated tokens |
|---|---|---|---|---|
Raw | 24.02s | 1,074 | 358,678 | 89,669.50 |
Distilled summary of the same log | 15.01s | 4 | 240 | 60.00 |
That is:
99.93%fewer characters presented to the agenta
1,494.49xcompression factor
In the captured run, the failing test was projects can be order by name(), and the distilled summary matched the XML result we used for validation.
This is the kind of improvement that gets lost in broader averages. If the task is "run a suite and decide what matters," raw logs are usually one of the worst places to spend premium reasoning tokens.
Here is a compact before/after of the same run.
Without Distill, the agent is looking at a long stream and has to pick out the useful part itself:
If the suite succeeds, you still get the same style of long application and test output. If it fails, you get that plus the stacktrace, but still no compact answer about what actually matters next.
With Distill, the same run becomes decision-ready:
And when the run is clean, the shape can stay just as small:
2. Exploring a project domain with shell commands vs Graphify
The second micro-benchmark focused on repo exploration.
Question:
How are default project roles and ownership transfer implemented across the project domain?
For the shell-based version, we kept the workflow realistic and disciplined:
one targeted
rgtargeted slices from
ProjectRoutes.kttargeted slices from
ProjectService.kttargeted slices from
ProjectRepository.ktthe
ProjectMemberRole.ktenum
For the graph-based version, we rebuilt the server-app-project scope and ran one Graphify query on the same question.
Again, we estimated token volume with characters / 4.
View | Lines | Characters | Estimated tokens |
|---|---|---|---|
Realistic shell exploration bundle | 352 | 17,252 | 4,313.00 |
Graphify query output | 25 | 4,239 | 1,059.75 |
That is:
75.43%fewer characters for the graph-based exploration viewa
4.07xreduction in this realistic exploration pass
And this is the practical difference.
Without a graph, even a disciplined exploration flow still means chaining together multiple searches and file reads:
That is 6 separate reads/queries just to get a first useful picture of the domain.
With the graph already built, the starting point becomes much smaller:
And the returned nodes are already clustered around the interesting concepts:
That does not replace source inspection. It just gives you a much better first cut on where to spend your attention.
The graph is easier to understand if you think of it as a small map, not as raw JSON.
In this case, one useful cluster looks roughly like this:
And the relation layer is what makes it useful:
That means the graph is not only telling us "here are some files." It is also telling us which files are central, which concepts live inside them, and which clusters belong to the same topic.
That style of structure is why graph-based exploration works well here: it gives the agent a map of what exists and how pieces are related before it starts opening file after file.
This is the more honest "engineer workflow" story.
We also ran Graphify's built-in benchmark on the same scope as a separate supporting datapoint. That tool estimated:
a naive corpus pass at
~39,533tokensan average Graphify query cost of
~1,256tokensa
31.5xreduction per query
That number is useful, but it is not the same as the realistic shell comparison above, so we are keeping it separate on purpose.
Why this matters more than it used to
A lot of AI cost today is still hidden by product packaging.
When the unit economics are softened by credits, bundled pricing, or experimental budgets, waste does not feel urgent. Teams focus on whether the workflow works at all, not whether it scales cleanly.
But once AI becomes normal inside the engineering org, the waste compounds:
every test run
every repo exploration pass
every agent tool call
every retry caused by bloated context
every developer using the system every day
At that point, token efficiency stops being a nice optimization and becomes operational hygiene.
This applies just as much to private and local deployments. Even when the model is running in-house, pipeline waste still burns throughput, raises latency, and lowers the number of useful tasks you can run at once.
What actually reduced the waste here
This benchmark was not about a magic prompt.
It came from tightening three layers of the workflow:
Distillation
Distillation is useful when the output is large but the next decision is small.
Typical examples:
test runs
stack traces
verbose build output
long diffs
logs
The model should spend reasoning on the decision, not on thousands of lines of boilerplate.
Graph-based exploration
Graphify is not a replacement for direct source inspection.
It is useful when the question is structural:
where should I start?
what connects X to Y?
which files are central here?
how do I narrow this domain before opening files?
That matters in large repos where the real tax is not editing, but navigation.
AGENTS.md / CLAUDE.md
A good AGENTS.md/CLAUDE.md changes agent behavior before the first expensive mistake happens.
It tells the agent:
where to start for a given task
when to avoid broad repo scans
when to validate narrowly
when to use
rgvs mapping toolswhat "smallest useful scope" means in this codebase
That sounds simple, but it directly affects token usage, latency, and repeatability.
A simpler rule for reasoning effort
Not every task deserves maximum thinking.
Here is the practical version:
Task type | Best default |
|---|---|
Small known fix | Keep the thread short and the reasoning light |
Bug with unclear cause | Spend more on diagnosis before editing |
Refactor with multiple moving parts | Use higher-effort planning, then cheaper execution when possible |
Large repo exploration | Use maps and summaries first, not raw code dumps plus max reasoning |
The right goal is not "think harder everywhere."
It is "spend deep reasoning where it prevents failure loops, and cut waste everywhere else."
Because high reasoning on every task has side effects too:
it costs more
it usually responds more slowly
it can over-analyze simple tasks that should have been solved directly
it can drift into broader plans when the task only needed a small edit
it can hide the real issue under a lot of extra text
More is not always better. A lot of people default to max effort because it feels safer, but in practice that can make the workflow slower, noisier, and less focused.
The compounding effect
The broader benchmark already showed what a cleaner pipeline can do in a realistic mixed task: 35.79% fewer input tokens and 26.67% faster completion in the strongest setup.
The micro-benchmarks show something even more important:
noisy test runs can be compressed dramatically
repo exploration can be narrowed before the model reads too much
That is exactly how small workflow improvements become large operational savings over time.
One improvement a day sounds minor.
But one fewer bloated test run, one tighter search pass, one better repo instruction, one less redundant read loop, repeated across a team for months, adds up much faster than people think.
The takeaway is simple:
better models matter, but better pipelines are starting to matter just as much.
If your AI workflow is going to become daily engineering infrastructure, this is the right moment to reduce the noise before the cost curve makes the decision for you.
Author: Francisco Garcia Sierra, FullStack Developer at Zylon
Published: April 2026
Francisco is a FullStack Developer at Zylon working across product, infrastructure, and AI-powered developer workflows. He has built enterprise products end to end, from backend systems and APIs to frontend experiences and production integrations, with a strong focus on building reliable systems that scale in real-world environments. His background also includes blockchain and cryptography, which shapes the way he approaches security, system design, and trust in software. At Zylon, he works on turning advanced AI capabilities into practical tools that improve developer experience, reduce operational friction, and help teams ship faster with more control.
Published on
Writen by
Francisco García Sierra


